29 August 2009

Martin Armstrong & FOFOA articles

http://economicedge.blogspot.com/2009/08/martin-armstrong-will-gold-reach-5000.html

Armstrong believes that gold is NOT a hedge against inflation but rather a hedge against a loss of confidence in government. There is a difference, and Martin does a good job explaining it. He is reiterating his latest papers in stating that a loss of confidence in the government sector is coming soon if not here already.

He gives a complete technical update for gold stating:

“I have provided the technical analysis on Gold based on a monthly chart. The first real resistance is formed by the Primary Channel that shows $1,350 - $1,750 between 2010 and 2012. this represents still a plain old normal technical move with nothing that would reflect a meltdown. It is breaking this overhead resistance where it becomes support that we enter in the “danger zone” of a true meltdown in PUBLIC CONFIDENCE.

Most of the projected resistance from the major low back in 1999, shows various targets from $1,700 to $2,750. However, if gold exceeds this level and it too forms the subsequent support, now we are looking at the $3,500 to $5,000 target zone. This is where we see the potential for Gold is a true economic meltdown of CONFIDENCE.”

http://fofoa.blogspot.com/2009/08/no-free-lunch.html

Here is the problem though, kids. Most mature investors retain their life savings fully invested within the financial industry, denominated in dollars, and will not get off these tracks even when they see the train coming. They will stay there because it is impossible for them to believe they occupy the wrong position! Who can blame them or call them fools? They have been trained their whole life to believe in saving for the future inside of a monetary system that serves no purpose other than as a medium of exchange.

Worse, they perceive that all of their assets are correctly valued by this system that does not care about the value of a digit. How can they possibly be correctly valued in a system that only functions properly as a medium of exchange, not a store of value? How can assets meant to be stores of value be correctly valued when denominated in a unit whose value DOESN'T EVEN MATTER in the context of its primary function? They can't. They shouldn't. They aren't. And soon this FACT will be known by everyone.
25 August 2009

Power pentagons, Hayek, GFMS and Bear Traps

It is certainly quite in goldland these past few months. Both of my anecdotal indicators are down compared to a year ago when retail shortages were rife: posts on Kitco's forum and comments to article about gold on Seeking Alpha. Seems everyone is distracted by green shoots.

I have just finished The Myth of the Machine: The Pentagon of Power, which I mentioned in a Sep 08 post and republished on Seeking Alpha to very little acclaim :). I have pages of notes to bash into shape, nothing to do with gold but more on management theory (my BComm major) - organisations as totalitarian “regimes”, CEO's as dictators and if this is the environment in which people spend a lot of time and see as normal why would they see any problem with increasing Government intrusion and authoritanism. Considering that, was it a good idea to make organisation's legal entities/persons leading to reification that acts as a shield against any sense of responsibility by the individuals who actually make decisions? Anyway, I did say some panel beating was required.

I am currently reading Hayek's Serfdom Revisited (1985), put out by The Centre for Independent Studies, which should be familiar to Australians. Considering my previous comments about Governmental intrusion, I may wait until I finish this before writing a blog on the Lewis Mumford book.

I also found this article of interest: Adrian Douglas: GFMS cooks books to make gold look bad.I do think the GFMS/WGC numbers have some sticky tape and rubber bands holding them together. Admittedly it is difficult to really know what is going on in gold, but they don't really explain how they do their numbers or give some +/- confidence levels. I think they want people to think it is super accurate and this works because a lot of people really treat it as gospel.

The dodgy nature of the GFMS numbers is revealed if you go to the WGC website and go through their past Demand Trends reports, which I did when putting together some numbers for the Mint's CEO on general supply/demand trends (as detailed in this Mar 09 post). If you go through each Demand Trends report and compare the figures it it to the previous report, you will see all the revisions. And I'm not talking about just revising the prior period's figures, which you can expect. The reports usually have 5 quarters of past data. If you look at a specific quarter as reported originally and then subsequently in the following 5 reports, you can see them changing the figure each quarter, that is, they are revising supply demand numbers every quarter over one year later!

If I could be bothered getting the data off it, it would make for an interesting analysis of the accuracy of the data – memo to self: write GFMS expose blog.

Finally, I found in the Mint's library/archives a report by Blanchard and Company Inc titled “Gold Bullion: Caught in a Bear Trap”. I remember when it first came out, we got one of the advance copies December 2001 (note the date), 53 pages in all. Quote: “Sell your gold and take your tax losses now, before they get even bigger. If, at some time in the future, you find that you miss your gold, you'll be able to buy more of it for less.” I leave it to Mineweb, Maurice Rosen and Clif Droke to give you more details (everything is remembered on the Internet). Memo to self 2: never make ballsy calls on the direction of the gold price!

15 August 2009

Animated Gold Lease Rate Curve

I've been playing around with Google Docs. This chart shows the change in the lease rate curve over time. Key feature is the kick up that happens in the short end during certain periods, when the curve inverts. For it to make sense, change the x-axis to alphabetical order.

14 August 2009

Gold to break $1000 but then down to $500!

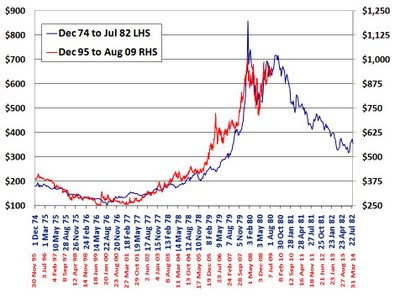
I have kept my super secret system a secret for many years, but I have to let you in on it now because a great calamity will befall gold shortly – once it breaks $1000 it will be downhill to $500. The chart below does not lie!


You will note on my chart that the time scales for the two different time periods does not match. This is because the world has gotten faster, information move quicker, therefore chart patterns are compressed. After many years of study I discovered that the world had accelerated by 40%, so that each day in the 1970s equals 1.4 days in the 1990s.

I then realised that one cannot study gold patterns until 1975, when it was no longer illegal to own gold. This allowed for human emotions to show up in prices. I then realised that the speeding up of information began in 1996, because this was the year that the Internet really began to take off. With this insight, I found this pattern and have kept it to myself to make massive profits but now the charts foretell collapse. You have been warned, get out now.

PS - As you can tell from the above that I don't put much store in reading tea leaves, sorry, charts. There is a legitimate use of them, but I think a lot of people choose timescales and see patterns just to reinforce their preconception.

10 August 2009

Silver ETF League Table

Further to my post on Gold ETFs, below are the figures for silver.


ETF/Custodial FacilitySilver Ounces as at July 2009% share of Total Privately Held
ishares283,831,31220.3%
Central Fund/Trust of Canada59,648,7934.3%
Zurcher Kantonalbank52,343,8423.7%
ETF Securities19,133,4591.4%
GoldMoney16,234,6171.2%
Bullion Management Group5,444,6850.4%
Claymore2,235,0000.2%
e-Gold85,2440.0%
Silver "Products" Sub-total438,956,95131.4%
COMEX118,227,4058.4%
TOCOM250,7780.0%
Total Other Privately Held842,564,86660.2%
Total Privately Held1,400,000,000100.0%


Compared to gold, the silver ETFs provide more transparency, which is another way of saying there is less privately held silver stock compared to gold.

Gold ETF League Table

With gold looking to attack the USD 1000 level, it is fitting to review the new kid on the gold block – securitised bullion – that many say has been a contributor to gold’s resurgence. I say “new kid on the block” because gold ETFs are only seven years old whereas people have been storing wealth via gold for over 4,000 years.

The key change ETFs have brought to the market is transparency. In the past, gold was purchased in bar or coin form and either stored at home, in safety deposit boxes, or with a custodian. Problem is that all this activity was private, with no reported numbers on the volume traded or held. The ETFs, by reporting their balances daily, now provide a small window into the activities of private investors.

According to the World Gold Council’s (WGC) 2007 figures, private investors (which includes institutions) hold 16.4% of all the gold ever produced (1). Adjusting for latest mine production, this means that as at March 2009 private investment in gold totalled 865 million ounces.

The table below shows all the ETFs and other non-listed custodian facilities who publish regular figures on their holdings. This data has been sourced from http://www.sharelynx.com/, who is the guru for data on gold. Sharelynx tracks all of these products daily and has built an extensive history on their movements, making it an essential subscription for any serious analyst of the gold markets.


Gold OuncesAs at July 2009% share of Total Privately Held Gold
Gold Bullion Securities40,465,4454.7%
Zurcher Kantonalbank4,738,3970.5%
ETF Securities2,716,2820.3%
ishares2,323,6770.3%
Julius Baer1,849,3750.2%
Central Fund/Trust of Canada1,571,0370.2%
Xetra Gold1,019,5400.1%
Bullion Vault583,7050.1%
GoldMoney425,1680.0%
Claymore366,0000.0%
Bullion Management Group92,5440.0%
Benchmark (India)68,6740.0%
e-Gold68,2080.0%
GoldIST Turkey46,7800.0%
UTI (India)46,1360.0%
Reliance Captial (India)38,9350.0%
SBI (India)23,9200.0%
Kotak (India)11,0600.0%
Quantum (India)1,9610.0%
Gold "Products" Sub-total56,456,8446.5%
COMEX9,140,6461.1%
TOCOM180,4640.0%
Total Other Privately Held798,816,80092.4%
Total Privately Held864,594,753100.0%


This table clearly shows that Gold Bullion Securities (listed across many exchanges) is the “King Kong” of gold products. What is more interesting is that it only represents 4.7% of the total amount of gold held by individuals and institutions. Even including in the reported physical inventories of the COMEX and TOCOM futures markets only brings us to 7.6%.

While this is a small “market share”, compare it to the situation five years ago. In July 2004 there were only five visible gold products totalling 2.4 million ounces. Combined with COMEX and TOCOM inventories, this amounted to less than 1% of privately held gold.

The other interesting feature of this table is the small size of the ETFs listed in Turkey and India. GoldIST has been around since 2004 and the Indian ETFs first appeared in mid-2007. By July 2007, there was 141,271 ounces in ETFs across both of these countries. Two years later is it a mere 237,466 ounces. Compared to the considerable size of the physical gold markets in these countries, this is not an impressive performance and shows their continued preference for physical over paper.

06 August 2009

Crash Course in Sound Economics

Amusing read from Unqualified Reservations (UR) blog. Introduction comments:

Here at UR, "economics" is not the study of how real economies work. It is the study of how economies should work - in other words, of how sound economies work. Sound economies, as we'll see, are also stable economies.

Since there are no economies on the planet which are even remotely sound, nor is there any prospect of any such thing appearing, this discipline cannot conceivably be empirical, quantitative, or worst of all predictive.

Readers familiar with Austrian economics will find much to skim, especially at the start, but should also watch out for nontrivial differences in the origin of money and the structure of the loan market.

05 August 2009

Conspiracy of Optimism

Love this comment on a Zero Hedge article:

As near as i can tell forecasters don't forecast anymore than analysts, analyze or reporters, report. What they do is cheerleader. They all are all engaged in the conspiracy of optimism. Which leads to delusions of prosperity.

Seriously if loose monetary policy and rapid asset inflation were the route to economic prosperity, Argentina would be the richest country in the world by now.


On another matter, I find it interesting how misinformation/misinterpretation is propagated on the Internet. Example is the Adrian Douglas piece The Alchemist, which lodges itself in people's minds in simplistic terms, as evidenced in this comment on a Seeking Alpha article:

Delivery of futures contracts in gold and silver is allowed in bullion or GLD and SLV.

The statement is refuted by another commenter kohalakid. I would also recommend Tom Szabo's Exchange of Futures for Physical (EFP) Explained.